


The Guide to HR Performance Indicators for Driving Your Strategy
HR performance indicators are much more than just numbers. They are the data that translates the effectiveness of your human strategy into clear and actionable metrics. They allow you to transform sometimes abstract concepts, such as engagement or retention, into concrete data. In short, they empower you to manage your talent with the same rigor as your finances.
Why HR Performance Indicators Have Become Essential
Not long ago, HR was often confined to purely administrative tasks. Today, the indicators they manage are at the heart of strategic decisions. It’s no longer just about counting days of absence or tracking headcount, but about telling a story: the health of your organization and its ability to achieve its goals.
Imagine you are behind the wheel of your car. You would never set off without checking your speed or fuel gauge, would you? It’s exactly the same for a company. It is unthinkable to drive it without measuring the performance of its most valuable asset: its employees. HR performance indicators are your navigation instruments.
From Administrative Reporting to Strategic Management
The change in perspective is fundamental. A classic report will tell you how many people left the company last quarter. A well-chosen performance indicator, like turnover cost, will show you the direct financial impact of those departures on your balance sheet.
This evolution finally allows you to link human initiatives to the overall performance of the company.
Investing in a wellness program is no longer just an expense. It’s a measurable action that, if effective, will result in a decrease in absenteeism and an increase in productivity.
Anticipate Rather Than Suffer
One of the greatest advantages of regularly tracking KPIs is their ability to sound the alarm before problems become critical. A slight increase in voluntary turnover among new hires can, for example, signal a flaw in your onboarding process, long before it turns into a real retention crisis.
Here’s what good indicators allow you to do:
- Justify investments: Demonstrate the return on investment of a training program, a salary review policy, or a new engagement tool.
- Align HR with strategy: Ensure that every HR action directly contributes to business objectives, whether it’s growth, innovation, or operational excellence.
- Improve employee experience: By measuring factors like engagement or satisfaction, you can make informed decisions to create a work environment where talent truly wants to thrive.
To go further and fully master this issue, this comprehensive guide on HR performance indicators is an excellent resource. Managing human performance is no longer an option; it’s a necessity to ensure the competitiveness and sustainability of your organization.
The Main Families of HR Indicators Explained
To make sense of the jungle of HR data, the simplest way is to group them into major families. Each family corresponds to a key stage in an employee's journey and answers specific questions. Think of it as the chapters of a book that tells the story of your human capital.
Analyzing these indicators is not just about stacking numbers in a table. It’s about understanding what each metric reveals about the health of your organization. This is what transforms simple data collection into truly informed decision-making.
This diagram perfectly illustrates how raw data transforms into KPIs, which in turn feed your strategic decisions.
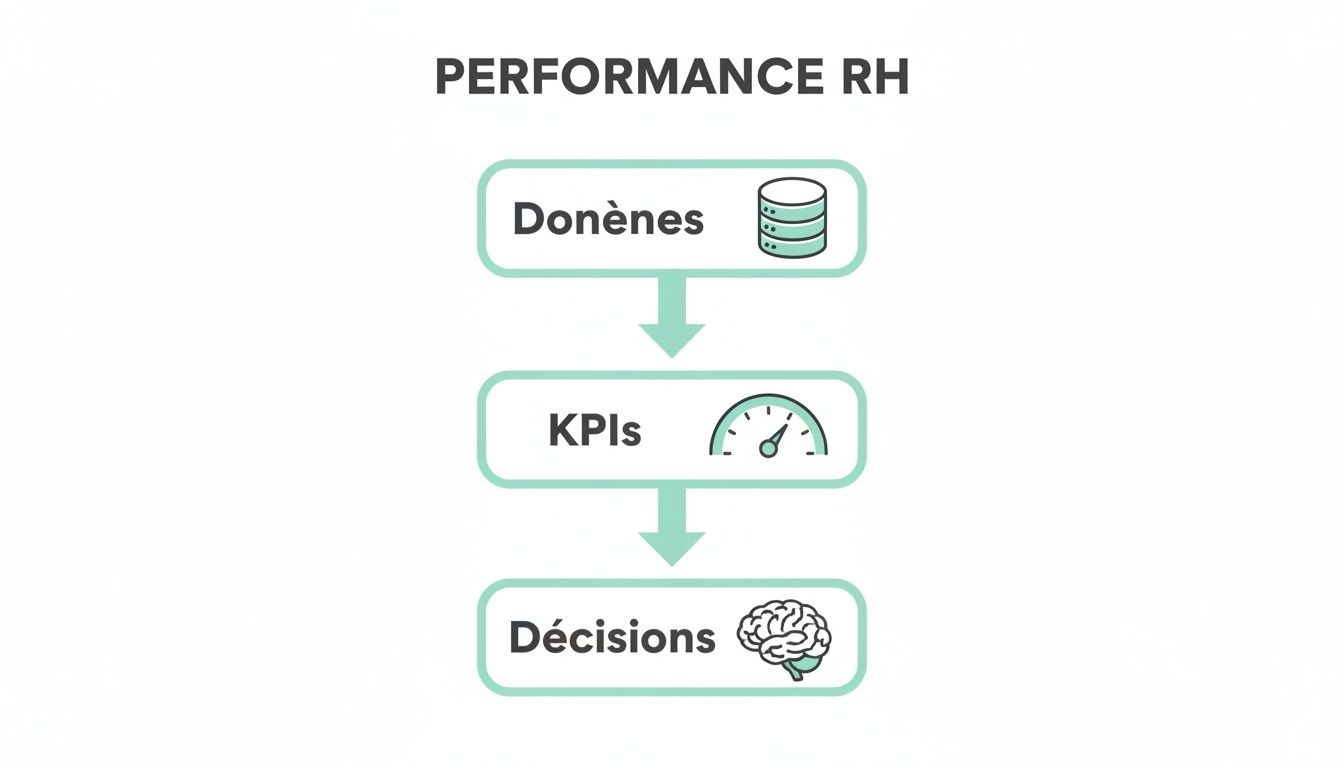
The flow is clear: without reliable data, your indicators are hollow, and your decisions are made blindly.
Recruitment Indicators
This first family serves to measure the effectiveness of your talent attraction machine. These KPIs help you answer questions like: "Are we good at finding the right people?" or "Is our recruitment process too long, too expensive?".
Here are the most common:
- Average time to hire: This is the number of days between the publication of a job offer and the moment a candidate signs. A prolonged timeline can reveal internal bottlenecks or real difficulties in finding the right profiles.
- Cost per hire: This adds up all recruitment-related expenses (agency fees, ad costs, recruiter time) and divides by the number of new hires. It’s an excellent way to measure the return on investment of your efforts.
- Quality of hire: Often measured after a few months, it assesses the performance of the newcomer, their integration into the culture, and their satisfaction. It’s the indicator that confirms whether you hired the right person, beyond just filling a position.
A high cost per hire is not necessarily bad news if it’s associated with excellent quality of hire. Context is key.
Retention Indicators
Once the talent is on board, the real challenge begins: keeping them. This family of indicators is the barometer of your teams' retention and loyalty. Good monitoring allows you to act before departures become a hemorrhage.
The turnover rate (or rotation rate) is perhaps the most famous. It calculates the percentage of employees who have left the company over a given period. It’s crucial to break it down to understand who is leaving (new hires or long-term employees? Voluntarily or not?). A high turnover among new hires, for example, can signal an issue in your onboarding process. To delve deeper, check out our article on onboarding new employees.
Other important KPIs include:
- Talent retention rate: The percentage of employees (often the highest performers) who stay with the company from one year to the next.
- Average tenure: This gives a good idea of the overall loyalty and stability of your teams.
Engagement and Social Climate Indicators
Engagement is what drives an employee to give their best. It’s an incredible performance driver, but often difficult to measure. These indicators aim to take the pulse of your organization.
An engaged employee is not just someone who shows up at the office. They are someone who feels connected to the company’s mission, is proactive, and contributes positively to the culture.
The key indicators in this category include:
- Employee Net Promoter Score (eNPS): It measures the likelihood that your employees would recommend your company as a great place to work.
- Absenteeism rate: If it skyrockets, it can be a symptom of malaise, excessive stress, or management issues.
- Participation rate in internal initiatives: Participation in events like sports prediction contests is an excellent thermometer of cohesion and adherence to company culture.
Training and Development Indicators
Investing in your teams' skills is vital to staying competitive. This last family of indicators measures the impact and effectiveness of your training programs.
It includes:
- Training budget per employee: Clearly shows the company’s investment in developing its employees.
- Training access rate: The percentage of employees who have taken at least one training course in the year.
- Training effectiveness: Assessed through participant feedback and, ideally, by measuring actual skill improvement on the job.
Despite their importance, many companies struggle to track these metrics in a structured way. In France, only 36% of companies integrate turnover reduction into their HR performance indicators, while 84% of HR decision-makers prioritize employee experience. This significant gap clearly shows the urgent need to realign measurement tools with strategic ambitions.
How to Measure Employee Engagement
Employee engagement is an incredibly powerful HR performance indicator, but it’s also one of the most difficult to quantify. We’re not just talking about happiness at work. It’s about capturing the emotional investment, the deep motivation that binds an employee to their company and its goals.
An engaged employee is not just there to clock in hours; they are a true player. They participate, propose ideas, and feel involved in collective success. That’s why measuring this engagement requires going well beyond the classic annual survey.

To get a realistic and up-to-date overview, the key is to mix declarative tools (what people say) with behavioral data analysis (what people do). This combination will give you an accurate picture of the pulse of your organization.
Declarative Tools to Gauge Perceptions
The most direct way to measure engagement is still to ask the main stakeholders for their opinions. But be careful, the way you ask questions is crucial to obtaining honest and useful answers.
The Employee Net Promoter Score (eNPS) is an excellent starting point. It relies on a single question: "On a scale of 0 to 10, how likely are you to recommend your company as a great place to work?" Simple, but effective. The responses classify your teams into three groups:
- Promoters (score 9-10): These are your ambassadors, your biggest fans.
- Passives (score 7-8): They are satisfied but not invested enough to become advocates.
- Detractors (score 0-6): They are potentially dissatisfied and may negatively impact the atmosphere.
The calculation is straightforward: eNPS = % Promoters - % Detractors. A positive score is already good news!
To complement this, pulse surveys are short surveys, often weekly or monthly, that allow you to track the mood of the troops in near real-time. It’s the perfect tool to quickly spot a friction point or measure the effect of a new initiative. If you’re interested in this topic, this article gives you plenty of ideas to measure employee engagement with modern approaches.
Transforming Behaviors into Tangible Indicators
What people say is one thing; what they do is another. Analyzing behaviors often provides a much more authentic measure of engagement, as it hasn’t been filtered through a questionnaire.
A high participation rate in non-mandatory activities is one of the most telling signs of a strong company culture and an invested workforce.
Think of all those initiatives that bring teams together outside the strict work framework. For example, the participation rate in a prediction challenge on a platform like ccup.io during the Euro or World Cup is an indicator of incredible richness.
This is not trivial at all. A participation rate of 80% in such events says a lot about:
- Team cohesion: People want to share fun moments together and build connections.
- Adherence to company culture: They resonate with the values of friendliness and team spirit that you promote.
- The quality of your internal communication: The information circulated well, it was interesting, and it sparked a desire to participate.
This indicator, simply calculated by the formula (Number of participants / Total workforce) * 100, transforms a simple activity into a strategic HR data point. It measures engagement in its most concrete form: the desire to be part of the company’s life. By tracking this number, you obtain a direct measure of the vitality of your social climate.
Setting Up an HR Dashboard That Drives Action
An overloaded dashboard with dozens of graphs may seem impressive, but it is rarely effective. The goal is not to show everything but to show what truly matters to trigger thoughtful action. It’s a navigation tool, not an encyclopedia.
Imagine the cockpit of an airplane. The pilot has access to hundreds of pieces of information, but they focus on a handful of critical instruments to reach their destination safely. Your mission is the same: identify the few vital HR performance indicators that will guide your strategy.
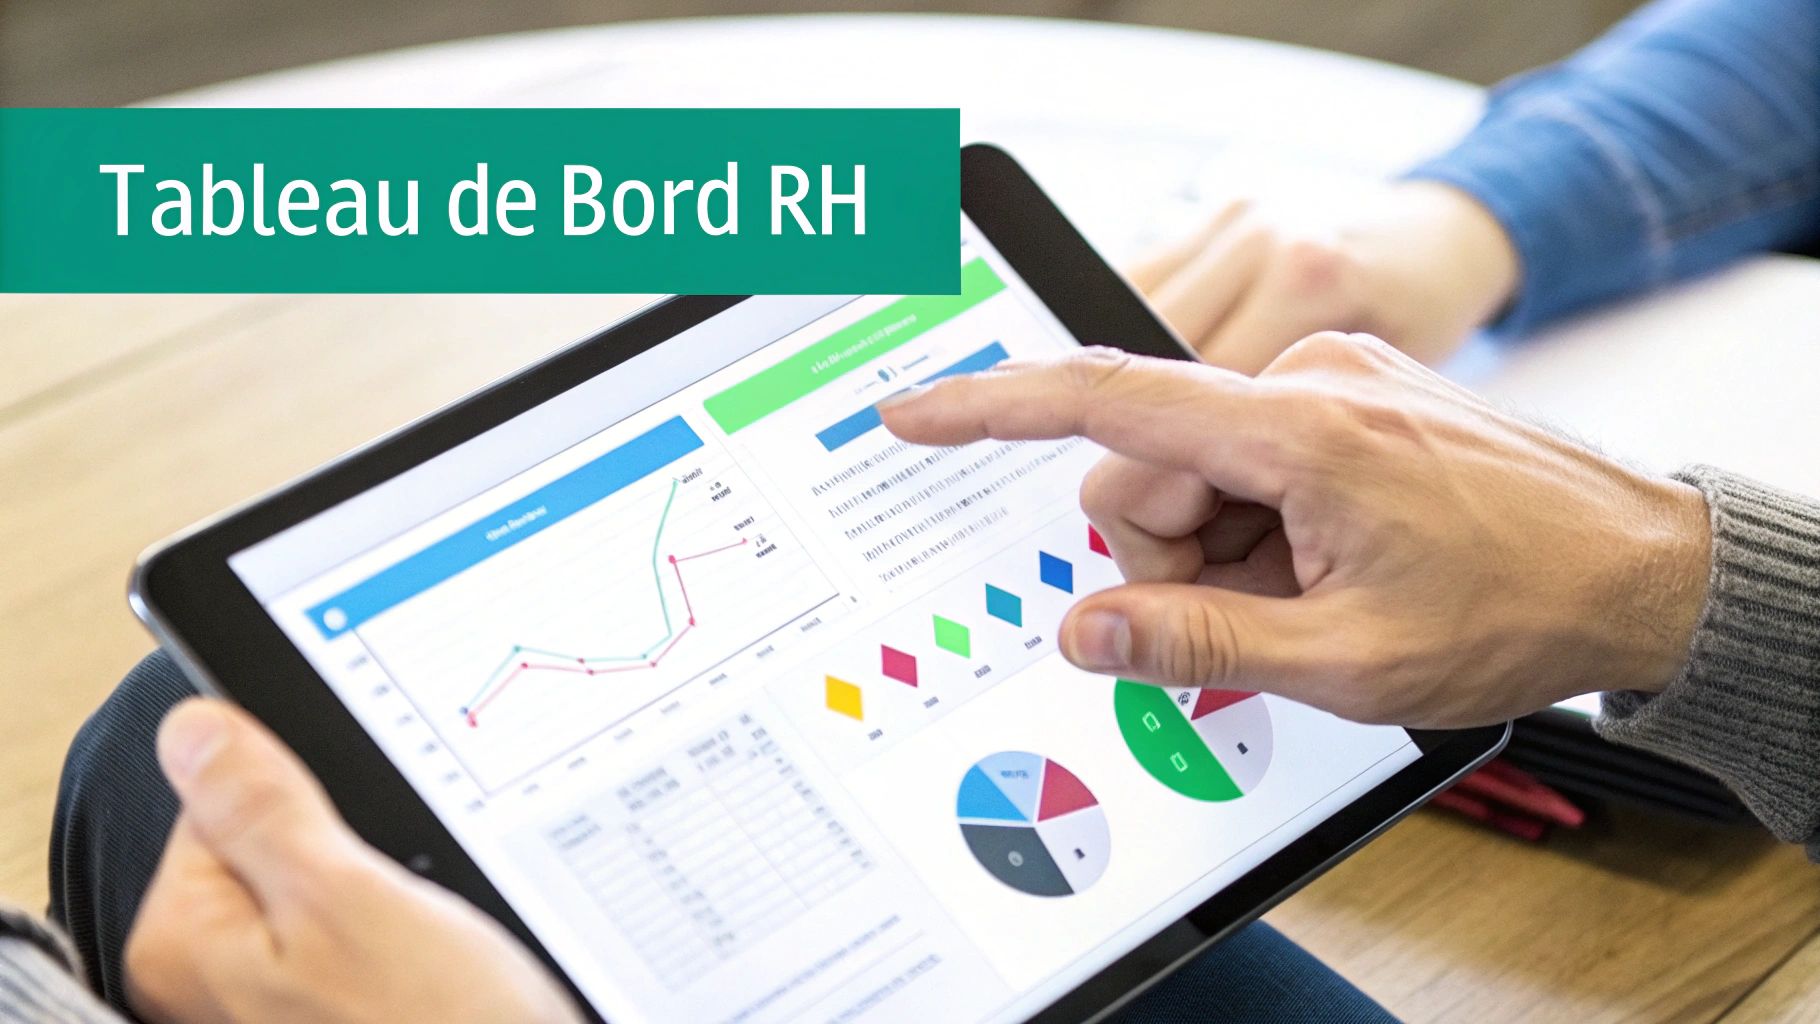
The golden rule is simplicity. A good dashboard rarely contains more than 5 to 10 KPIs at most. This number forces you to make choices and focus on what has a real impact on the company’s objectives.
Defining Your Priorities Before Choosing Your KPIs
The classic mistake is to jump straight into the indicators. You should do the opposite: start with your company’s strategic objectives. Each KPI should answer a specific business question.
To structure your thinking, follow these steps:
- Identify the major business objective: What is the company trying to achieve this year? It could be "Reduce operational costs by 15%" or "Accelerate our product innovation".
- Translate this objective into an HR priority: How can HR contribute directly? For example, "Reduce turnover of technical profiles that cost us a fortune" or "Improve the skills of the R&D team".
- Select the KPIs that measure this priority: It’s only at this stage that you choose your indicators. We’ll then talk about "Turnover rate of engineers" or "Number of training hours per developer".
This process ensures that every number you track is directly connected to the overall performance of the company.
Avoiding the Trap of 'Vanity Metrics'
Some indicators are flattering but provide no useful information for decision-making. These are called "vanity metrics". A typical example? The number of "likes" on a LinkedIn post from your career page. It’s nice to see, but it says nothing about the quality of the applications you receive.
A good HR performance indicator must be comparable (over time or with the industry), understandable by a non-specialist, and above all actionable. If you can’t do anything to influence it, it’s probably not a good KPI.
Always confront your indicators with the question: "If this number changes, what concrete decision will we make?". If the answer is vague, the indicator is likely to be reconsidered.
Choosing the Right Visualization Tools
The tool is just a means, but it must be suited to your needs and your level of maturity.
- To start (SMEs): A simple spreadsheet like Excel or Google Sheets often does the trick. It’s flexible and costs nothing. The important thing is to establish a rigorous updating routine.
- To go further: Business Intelligence (BI) tools like Tableau or Power BI allow you to create dynamic and interactive dashboards that can connect to multiple data sources.
- For integrated management: A modern Human Resource Management Information System (HRMIS) natively integrates reporting and analysis modules. There, you can be sure your data is always reliable and up to date.
Keep in mind that the perfect tool is the one your teams will actually use.
Concrete Example: The Dashboard of an SME
Let’s take the case of an SME with 150 people in tech. Its number one strategic objective is to retain its key talents to maintain its competitive advantage.
Its HR dashboard could focus on these 5 KPIs:
- Voluntary turnover rate (overall and by team): To monitor the hemorrhage.
- eNPS (quarterly): To take the pulse of engagement.
- Internal promotion rate: To check that careers are evolving well internally.
- Training budget used per employee: To ensure that investment in skills is indeed real.
- Average score on exit interviews: To understand the real reasons for departures.
This dashboard is simple, focused on a single objective, and each metric can trigger a specific action. For example, a drop in eNPS in the product team could initiate a series of individual interviews to identify the discomfort. Also consider recognition strategies, as knowing how to reward employees is an extremely powerful retention lever.
It’s by creating this "measure, analyze, act" loop that your dashboard transitions from a simple report to a true management tool.
The Impact of Technology and AI on HR Management
The management of HR performance indicators is undergoing a transformation, and technology, particularly artificial intelligence, is at the forefront of this change. These tools are no longer just data calculators; they are radically changing how we perceive and act on our human capital.
Thanks to AI, we are moving from analysis that tells us what has happened to analysis that anticipates what is likely to happen. For an HR professional, this is a true paradigm shift.
AI to Anticipate Human Dynamics
The real superpower of AI is its ability to spot weak signals, those small things that are almost invisible to the naked eye. By analyzing thousands of data points (always anonymized, of course), it can outline the contours of future major trends.
Here are a few concrete examples to better understand:
- Anticipating turnover: Imagine an algorithm that cross-references tenure, frequency of raises, feedback from satisfaction surveys, and even activity on internal tools. It can then identify the profiles most likely to leave the company in the coming months, long before they submit their resignation.
- Optimizing recruitment: By studying the paths of the highest-performing employees, AI helps identify candidates who are most likely not only to succeed but also to thrive long-term with you.
- Personalizing careers: Gone are the generic career plans. AI can suggest relevant training or internal mobility for each employee, based on their current skills and the future needs of the company.
Let’s be clear: these tools do not replace human judgment. They amplify it. They provide substance to initiate the right conversations and implement targeted actions before it’s too late.
Digital Adoption, the New Barometer of Your Maturity
The adoption of new digital tools by your teams has become a performance indicator in its own right. A high usage rate of a new HRMIS or collaborative platform is not trivial: it reveals the agility and adaptability of your entire organization.
And this transformation is accelerating. Today, 28% of French HR directors are already using AI, a spectacular jump from the 9% of the previous year. AI tools can, for example, reduce manual data entry time by 80%.
Yet, a challenge remains: only 25% of HR leaders admit that their teams are really thinking about the impact of these technologies on their work. Change management is therefore crucial. To go further, you can check out the 5 key HR figures for the future on Comundi.fr.
Technology is not an end in itself. Its true purpose is to free HR professionals from administrative and repetitive tasks so they can focus on their core business: the human aspect.
By automating reporting and basic analyses, technology gives back time and a broader perspective. HR teams can finally dedicate themselves to interpreting trends, engaging in dialogue with employees, and building human strategies that have a real impact. The challenge is not to endure technology but to manage it so that it serves a human vision. And not the other way around.
For an HR Strategy that Combines Performance and Humanity
HR performance indicators are not a finish line. See them instead as the starting point of a much more strategic reflection, the instruments that help you align the economic performance of the company with the well-being and development of your teams.
Imagine a conductor. They don’t just read their score; they listen to each musician, adjust the tempo, and ensure that the harmony is perfect. In the same way, your role goes beyond simple data collection. It’s about interpreting them to create a symphony where each employee can give their best.
The Balance Between Numbers and Humanity
The true strength of an HR strategy does not come solely from the accuracy of KPIs but from its ability to find the right balance. Quantitative data is there to measure objective performance, while qualitative feedback gives you the pulse of the human experience.
One without the other is an incomplete story. An excellent retention rate doesn’t mean much if your teams are demotivated. Conversely, a top eNPS must translate into concrete collective performance. It’s in this complementarity that the key to effective and respectful talent management lies.
The greatest risk is not measuring poorly but measuring what doesn’t matter. Your indicators must always serve a vision: that of a company culture where performance and humanity nourish each other.
One Step at a Time, But Start Now
If there were only one piece of advice to remember, it would be this: start small. There’s no need to build a comprehensive dashboard right away that would end up drowning you in information. A gradual approach is much more effective.
Here’s a simple roadmap to get started:
- Choose 3 to 5 indicators that directly address your number one challenge at the moment (turnover, time to hire, engagement...).
- Measure them rigorously for a quarter to establish a solid baseline.
- Analyze the initial trends and launch one or two targeted actions to see if you can influence them.
- Evaluate the impact of your actions in the following quarter. Then, adjust or add new indicators.
It’s this virtuous cycle – measure, act, improve – that will gradually transform your HR performance indicators into true decision-making levers. That’s how you will build a culture that sustainably supports the growth of your company and the flourishing of your employees.
Your Questions About HR Performance Indicators
Diving into the world of HR performance indicators often raises a host of very concrete questions. We will answer them here, straightforwardly, to help you move from theory to implementation that truly works in your company.
The idea? To give you clear, direct, and immediately applicable answers. Enough to lift the last doubts and launch you with confidence to manage your human strategy with more precision.
Which HR Indicators to Start With When You're New?
Diving into KPI tracking can quickly seem daunting. The best advice: start simple. Focus on a handful of key indicators that give you a good snapshot of your company’s health without drowning in complexity.
For a company just starting out, 3 to 5 indicators are more than sufficient.
Here’s our recommended starter pack:
- Turnover rate: This is the ultimate barometer. It tells you if people are happy with you and if you’re managing to keep your talent.
- Average time to hire: This measures the efficiency of your hiring. If it’s too long, you’re missing out on the best profiles, plain and simple.
- Absenteeism rate: This is a bit like the warning light for the social climate. A sudden increase? There may be a management or well-being issue to explore.
- Employee Net Promoter Score (eNPS): A simple but powerful survey. It gives you a first reliable measure of engagement and satisfaction among your teams.
With this foundation, you already have a 360-degree view of the crucial moments in your employees' lives.
How Often to Track and Communicate HR KPIs?
The right cadence is essential for turning numbers into actions. Not all HR performance indicators are tracked at the same pace, and they are not communicated the same way to everyone.
The ideal frequency depends on the nature of the indicator.
A good indicator is tracked often enough to spot a trend, but not so much that you jump at every fluctuation. Consistency is more important than immediacy.
Here’s a sensible breakdown:
- Monthly: Perfect for operational indicators like absenteeism rate or recruitment tracking. This allows managers to react quickly. A simple and visual report does the job perfectly.
- Quarterly: Ideal for more strategic indicators like turnover rate or eNPS. This distance allows you to see the real underlying trends and avoid unnecessary alarm. It’s the right rhythm for reporting to management.
- Annually: This is the time to take a comprehensive look with all employees. It’s a great signal of transparency that shows their feedback is genuinely considered in the strategy.
Adapting communication to each audience is what brings the numbers to life and engages everyone.
How to Link HR Indicators to Financial Objectives?
This is where everything plays out. This step shifts the HR function from a "cost center" to a true strategic business partner. For your numbers to resonate with your management, you need to translate them into euros. This justifies investments and proves the value of what you do.
The secret is to calculate the return on investment (ROI) of your human actions.
For each HR performance indicator, ask yourself: "What does this cost or bring to the company in concrete terms?".
For example, don’t just announce a turnover rate of 15%. Calculate its real cost: add up recruitment expenses (ads, agencies), the cost of training new hires, the loss of productivity while they become operational... And there, you can show that an HR action that reduces this rate by just 2% saves the company tens of thousands of euros.
The same logic applies to engagement: an increase in eNPS can be directly linked to better productivity or increased customer satisfaction. By presenting your projects from this financial angle, you completely change the perception of your department.
Engage your teams and measure their commitment concretely with ccup.io. Transform major sporting events into a powerful lever for cohesion and motivation.
Discover how to create your prediction contest in just a few clicks on ccup.io
From Content To Conversion
Turn your next sports event into a company prediction contest
Discover the platform, explore available competitions, and launch a branded experience that supports engagement, internal communication, and team cohesion.
See available competitionsLatest articles

6 hours ago
How to Lead an Engaging Team Meeting
Let's be honest: we've all experienced meetings that drag on for no reason. This infamous "meetingitis" is not a fatality. It's just a symptom of bad habits and outdated methods.
The idea is to transform this often-dreaded appointment into a real moment of exchange and decision-making. A g...

3 days ago
Your Serie A Prediction Guide for the 7 Best Tools 2026
The Serie A, with its tactical duels and twists, is an exciting playground for prediction enthusiasts. But how do you move from intuition to structured analysis? To succeed in your next Serie A prediction, it is essential to rely on effective tools that combine advanced statistic...
Contact us
For any question or quotation requests, do not hesitate to reach us by phone at 01 83 79 24 54 or by email : contact@ccup.io
Contact us

Frequently asked questions
What is ccup.io?
Ccup.io is a cohesion tool, allowing firms to gather their collaborators on the occasion of major sporting events, such as World Cup or Olympic Games. We offer an interactive forecasting platform, turnkey and customisable to your company’s colours.
What are you doing with our data?
By deciding to use our services, you decide to entrust us a part of your data – this will allow us to optimise your experience. We place great emphasis on the protection of your data, in compliance with current regulations. Given that it is important to be informed on the issues and challenges of personal data protection, ccup.io provides you with a most complete documentation on this matter.
How much does it cost?
In order to give our clients flexibility, we make a special rate depending on the number of registered players using a degressive system for an important number of participants. This allows firms to organise tailored events, adapted to their capacity. To receive a commercial offer in less than an hour, you only need to fill out the quotation requests form, with just a few clicks.


Don’t miss this opportunity 😍
Start now and enjoy numerous benefits